I build the rigorous tools I wished my projects had.
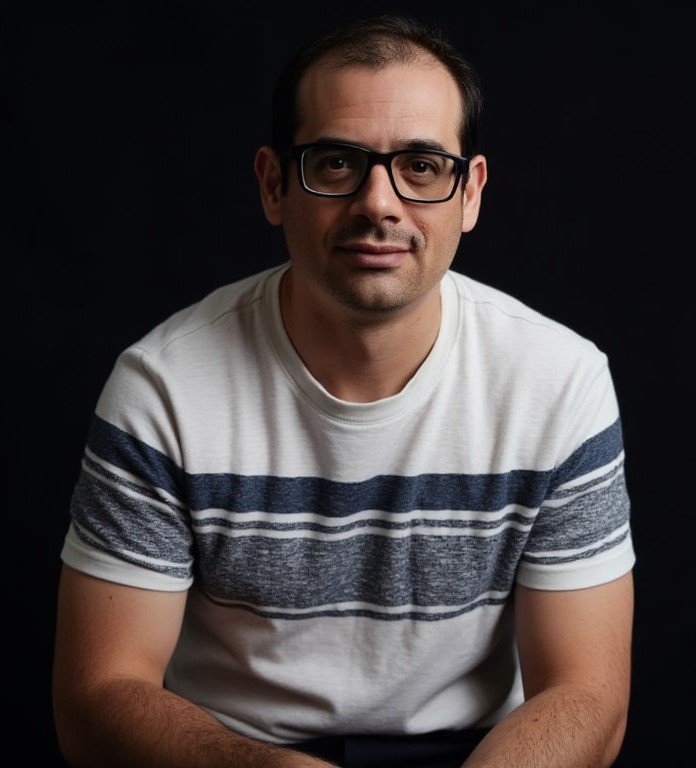
I’m Marcel — a geologist and hydrogeologist who got tired of messy, black-box environmental analysis and decided to do something about it. GeoRGB is the result: a one-person mission to make geostatistics reproducible, auditable, and genuinely useful.
Geology / Hydro / GIS
Soil & groundwater projects
Drilling operations supervised
YouTube subscribers
Online students taught
The short version of a long road.
My career began in the field, on petroleum-contaminated sites — soil and groundwater, drilling programs, remediation systems, contaminant plumes, and conceptual site models. The kind of work where a wrong interpretation has real consequences. I trained as a geologist, specialised in hydrogeology, and then did a Master’s in GIS because I wanted to see the data, not just tabulate it. Suddenly I could find patterns and tell stories through maps that made sense of messy environmental data.
01The accidental beginning
Years later, working at an environmental consultancy, I noticed something that bothered me: the team produced excellent science but couldn’t turn it into maps. The figures were outsourced to a drafter who knew the drawing software but nothing about the environment — you told them what to draw, and they drew it, with no judgment of their own.
I already knew how to do all of it myself with free, open-source tools. So I offered to train the whole team. The answer was silence — no real interest, no follow-up. I’d already recorded a handful of training videos by then, and I was left with a simple question: what do I do with all this material?
“So I published it. That handful of training videos became a channel, the channel became a community, and the community became GeoRGB.”
02From frustration to a system
What started as leftover training footage grew into something I never planned: a platform with thousands of students and a YouTube channel with a community of ten thousand. But the deeper I went into geostatistics, the more I saw the same problem everywhere — powerful methods locked inside expensive black boxes, or scattered across scripts nobody could audit.
So I started building my own: a modular system of R tools for QGIS that don’t just compute a result, but explain their reasoning — generating professional, auditable reports a regulator could read. Rigorous, reproducible, and honest about their own assumptions. That system is what GeoRGB is today, and it keeps growing.
Two decades, logged like a borehole.
A geologist reads history from the bottom up. Here's mine — each stratum a stage, youngest at the top.
Building an auditable geostatistics system
A modular pipeline of R tools for QGIS — trend and covariate diagnostics, variogram modelling, kriging — every module producing regulator-ready reports and a machine-readable decision chain.
Environmental site assessment & hydrogeology
Phase II/III ESAs and groundwater work on upstream oil & gas sites — sampling design, monitoring networks, and the data problems that inspired everything I build now.
M.Sc. Geographic Information Systems
The turning point: from tabulating environmental data to seeing it — spatial analysis, cartography, and the start of scripting my own tools.
Postgraduate in Hydrogeology
Groundwater flow, contaminant movement, well hydraulics — the physics underneath every plume map I've drawn since.
Petroleum-contaminated sites, downstream
Drilling operations, active remediation systems — soil vapour extraction, pump & treat, bioventing. Where I learned that a wrong interpretation has real consequences.
B.Sc. + M.Sc. Geology — bedrock
Where it all sits on. Field mapping, mineralogy, stratigraphy — and the habit of reading a story from layers.
The work, not the words.
Tools that explain their reasoning. Real outputs of environmental projects — kriging maps, decision-chain reports, and custom plugins.
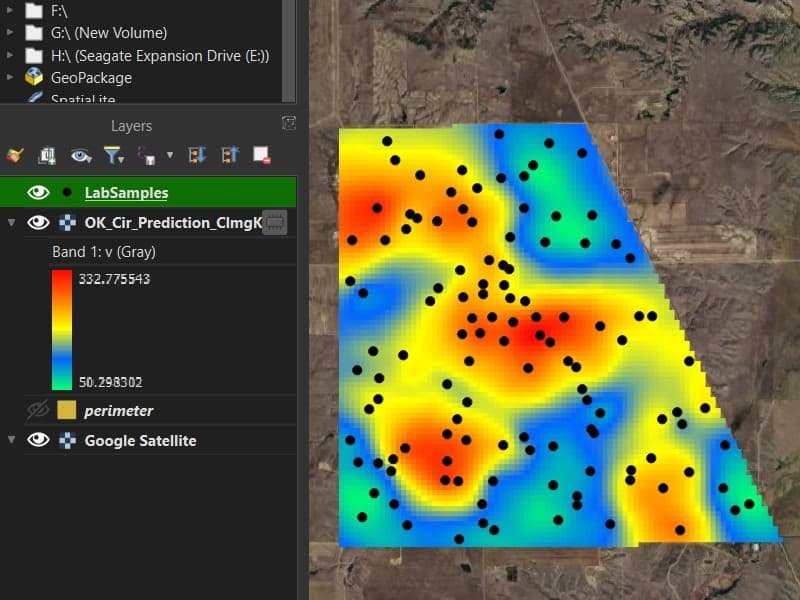
Kriging surface interpolated concentration map
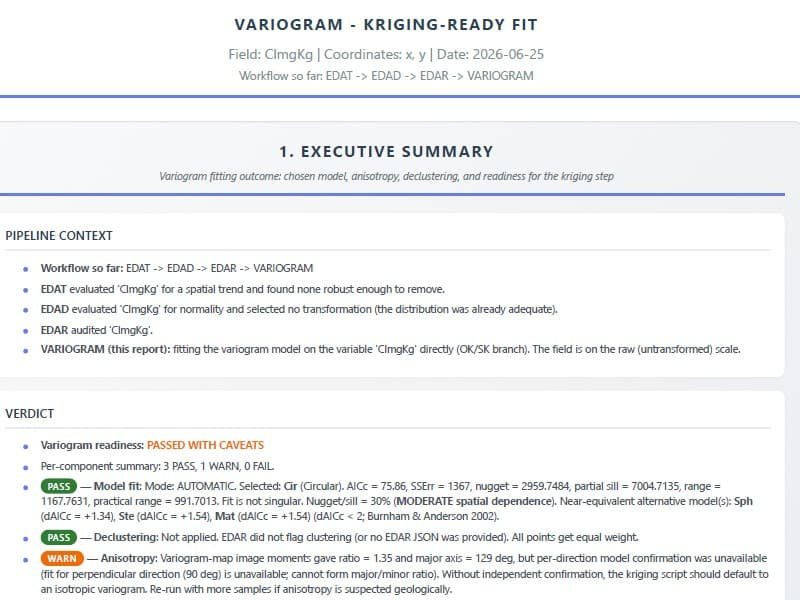
Pipeline report decision chain a regulator can read
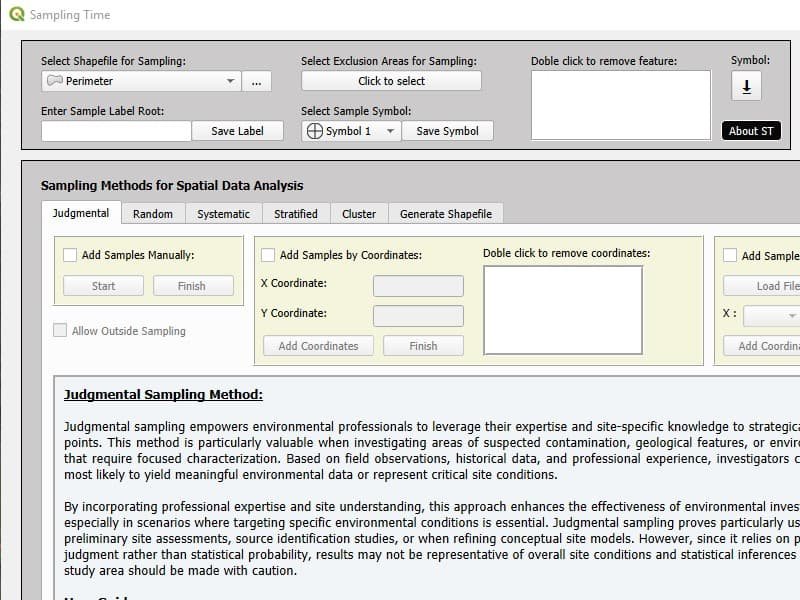
Sampling Time QGIS plugin, 2,100+ downloads
What I do now
Two threads of the same career: the field knowledge I teach, and the tools I build to make environmental site data reproducible.
// the ground I know
Contaminated sites, start to finish
Soil and groundwater investigations, site conceptual models and remediation — running the fieldwork, reading the subsurface from borehole logs, mapping it at surface and depth, and writing the reports that tie it together. A career spent understanding how geology, hydrogeology and contaminants behave in the ground, now taught the way real projects run.
site conceptual models
remediation
remote sensing
// the tools I build
Spatial data analysis, automated
An interchangeable ecosystem of R-in-QGIS modules that assemble into custom pipelines — from exploratory data analysis to geostatistical prediction across multiple interpolation methods — generating the charts, maps and science-grade reports automatically. Reproducible workflows that replace hours of manual analysis with results ready to deliver and audit.
exploratory analysis
spatial interpolation
automated reporting
Have a hard environmental problem worth solving properly?
I take on a small number of remote collaborations worldwide, alongside on-site projects across Canada — custom geostatistics, automated reporting, and GIS/AI tools for environmental projects.