Kriging in QGIS: The Ultimate Guide to Mastering It.
Stay Updated: Follow Us for the Latest News and Tips.
Chapter 1: Understanding the Basics of Kriging
Definition and Principles of Kriging
Types of Kriging and Their Applications
Advantages of Using Kriging in Geospatial Analysis
Chapter 2: Getting Started with QGIS
Introduction to QGIS: Features and Capabilities
Quantum GIS (QGIS) is an open-source Geographic Information System that has become indispensable for geospatial professionals worldwide. Its appeal lies in its extensive range of capabilities, enabling users to create, edit, visualize, analyze, and publish geospatial information on Windows, Mac, Linux, and BSD operating systems. QGIS supports vector, raster, and database formats, making it a versatile tool for comprehensive spatial analysis and mapping. Its features include advanced map composition, analysis tools, plugins, and support for various GIS formats, allowing for the integration and manipulation of high-volume spatial data.
Installing QGIS and Setting Up Your Workspace
Installing QGIS is straightforward, thanks to its user-friendly setup. Start by visiting the official QGIS website and download the version that matches your operating system’s requirements. Follow the installation guide, which typically involves running the installer and following on-screen instructions. Once installed, setting up your workspace involves customizing QGIS to suit your specific project needs. This can include setting the default projection, organizing panels and toolbars, and configuring general settings to optimize performance.
Overview of QGIS Interface and Basic Functions
The QGIS interface is designed with intuitiveness in mind, providing easy access to a wide array of functions. Key components include:
- Toolbar: Houses tools for creating and editing spatial data, managing layers, and executing spatial analysis.
- Layers Panel: Displays a list of all the layers currently loaded into the project, allowing for easy management and manipulation.
- Map Canvas: The main viewing area where spatial data is displayed and interacted with.
- Menu Bar: Offers access to various QGIS features, including file management, layer controls, and settings.
- Status Bar: Displays information about the map canvas, including the current coordinate, scale, and projection.
Familiarizing yourself with these elements is crucial for navigating QGIS efficiently and making the most of its capabilities.
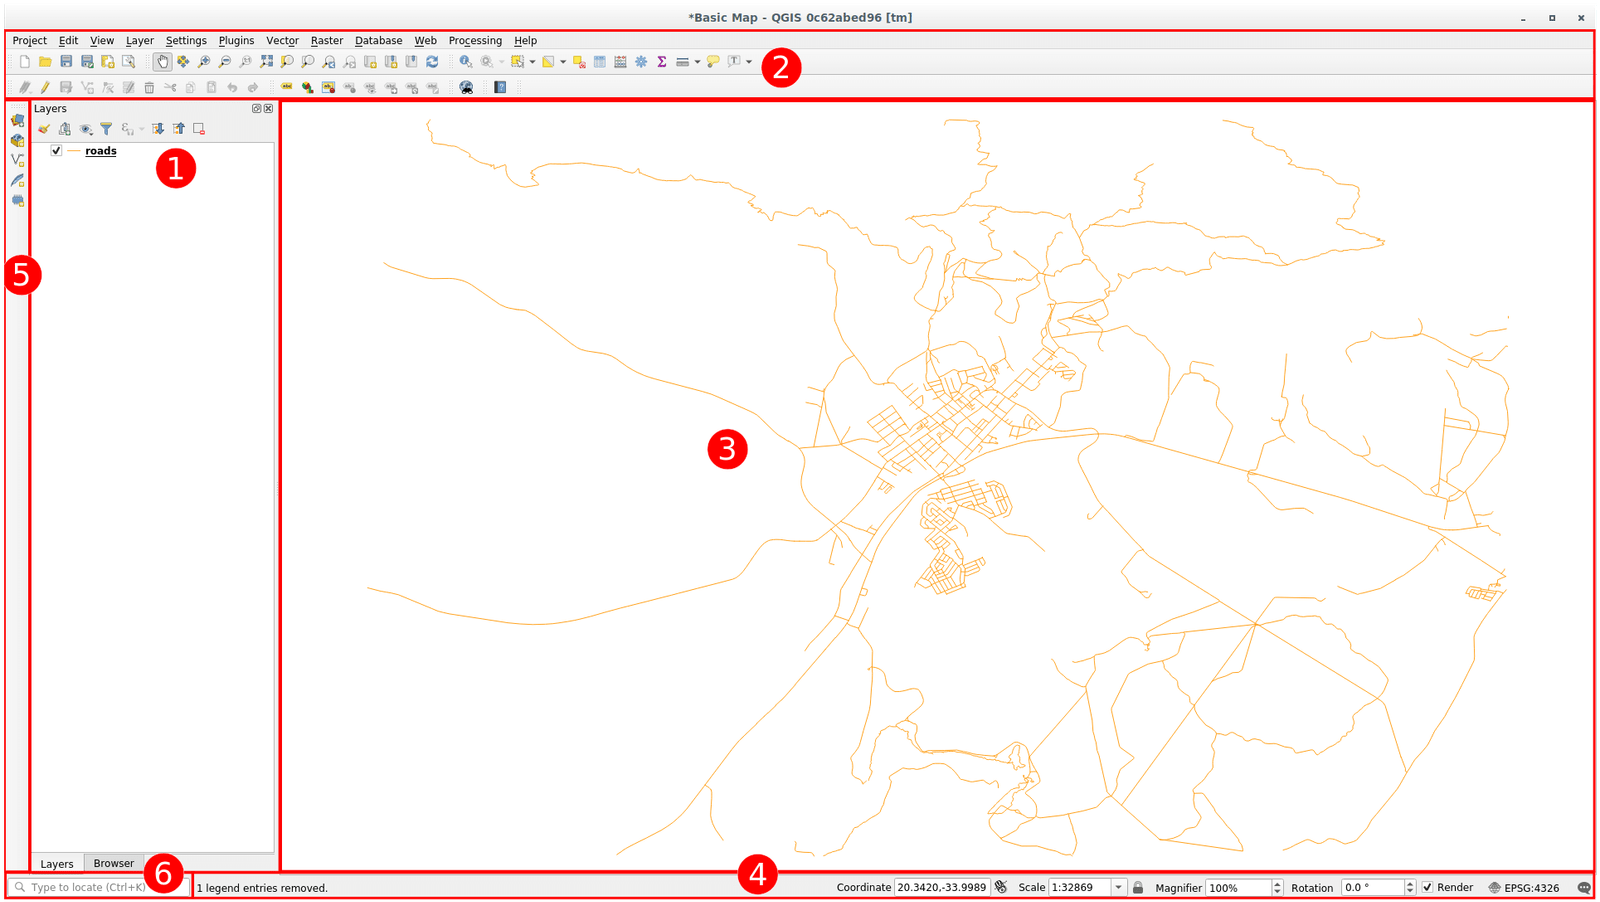
The elements identified in the figure above are: 1) Layers List / Browser Panel, 2) Toolbars, 3) Map canvas, 4) Status bar, 5) Side Toolbar and 6) Locator bar.
Chapter 3: Preparing Your Data for Kriging in QGIS
Data Collection and Management: Best Practices
Importing and Visualizing Spatial Data in QGIS
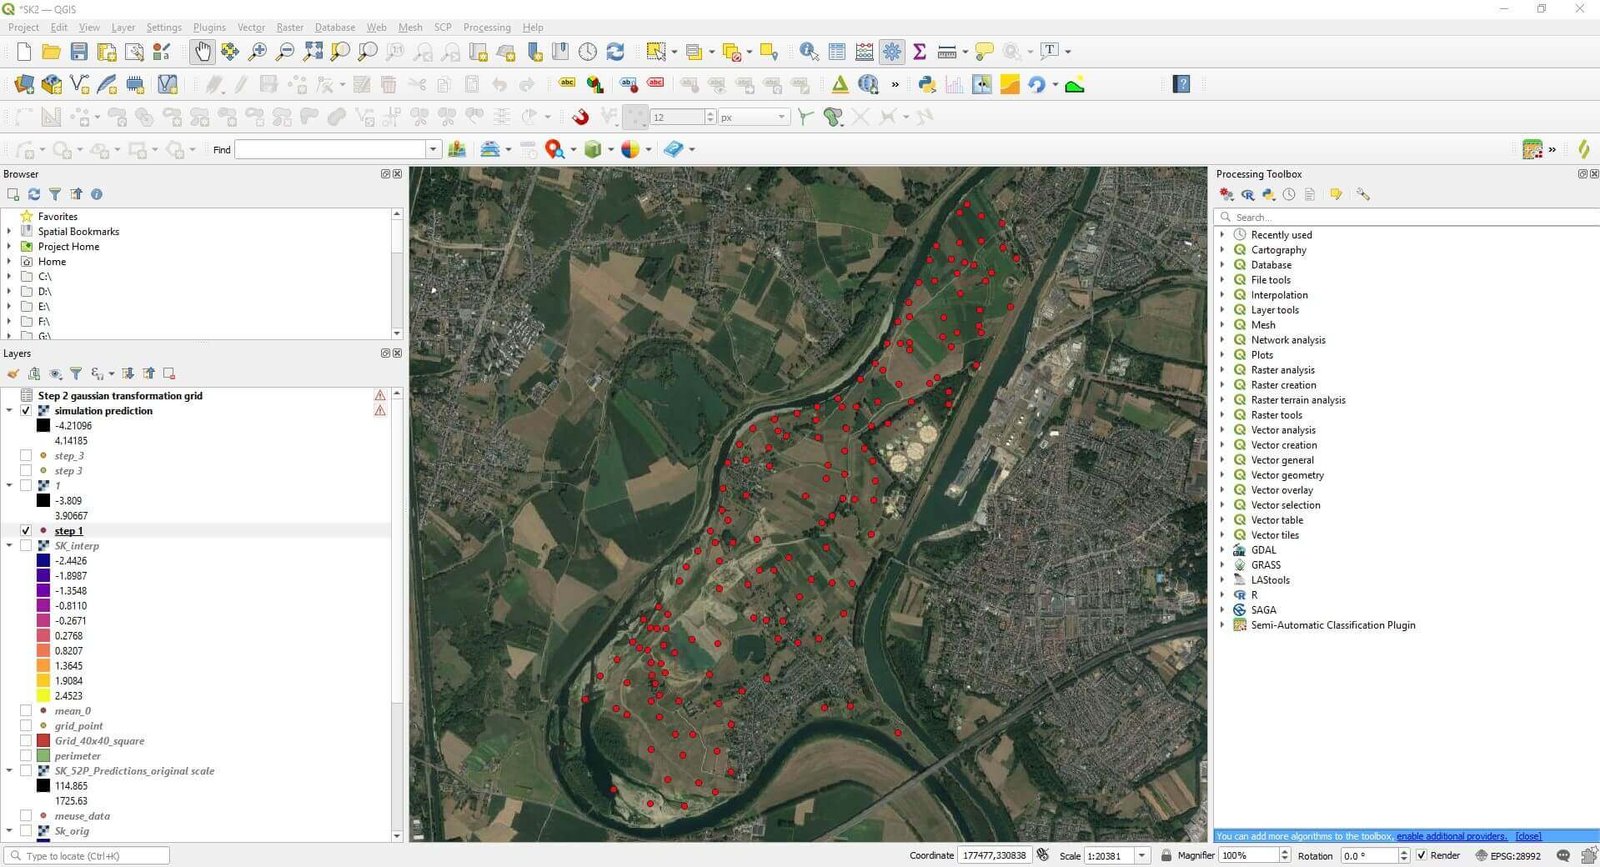
QGIS data display. Image taken from the lesson 2 of the Conditional Gaussian Simulation Course.
Understanding and Analyzing Your Spatial Data Structure
Chapter 4: Implementing Kriging in QGIS
Step-by-Step Guide to Performing Basic Kriging in QGIS
Kriging in QGIS can transform the way geospatial analysts interpret and predict spatial data. Here’s how to get started:
Selecting the Right Type of Kriging for Your Data
- Evaluate Your Data: Consider the spatial distribution and the presence of any trends within your dataset. This assessment will help determine the most appropriate kriging method.
- Choose the Kriging Type: For data without a clear trend, ordinary kriging is often suitable. If a trend is evident, consider using universal kriging. For categorical data, indicator kriging might be the best choice.
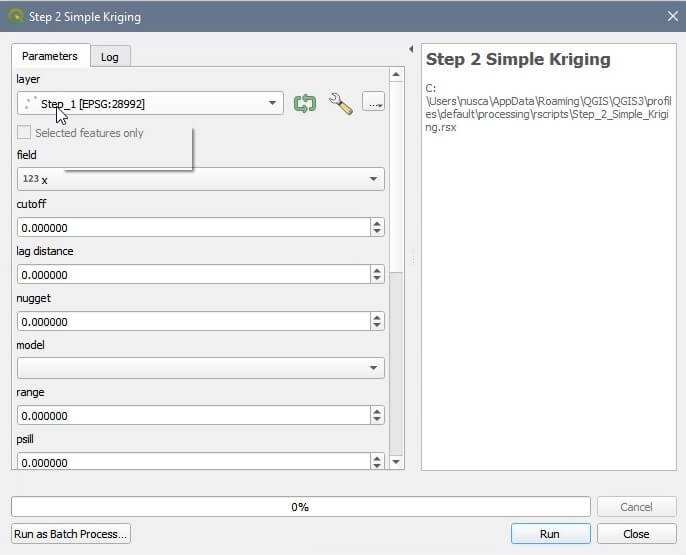
Setting Parameters for Kriging Analysis Using R in QGIS
Visualizing Kriging Results in QGIS
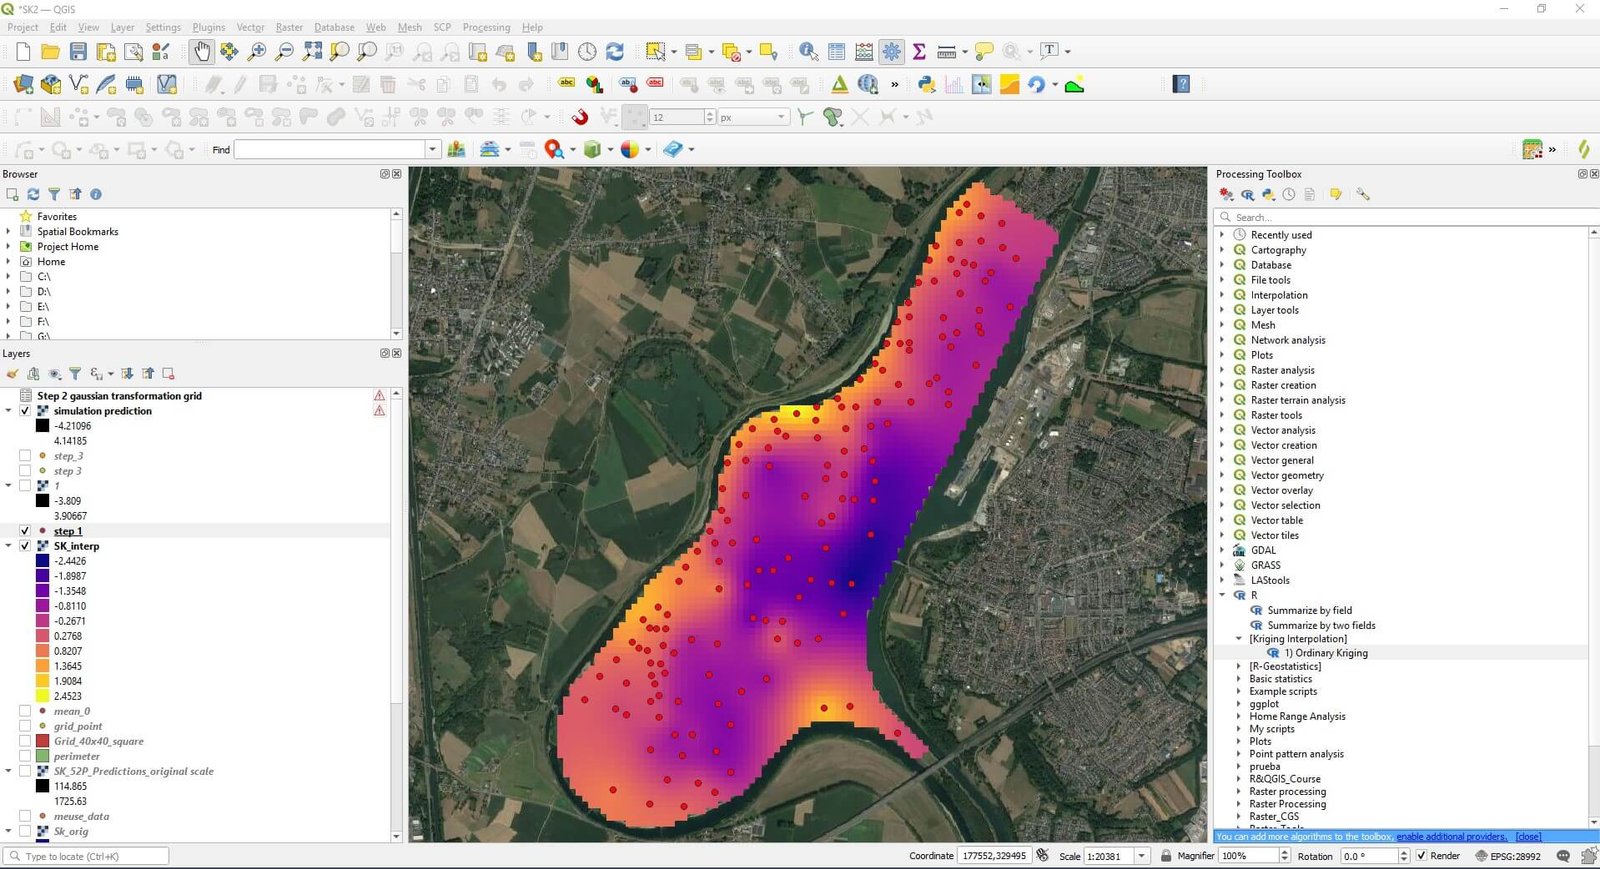
Assessing the Accuracy of Kriging Results
Evaluating the accuracy of your kriging results is crucial:
- Cross-Validation: Use a subset of your data as control points to compare the actual values against the predicted values from kriging.
- Error Metrics: Analyze metrics such as the Mean Squared Error (MSE) and the Root Mean Squared Error (RMSE) to quantify the accuracy of the predictions.
- Visual Inspection: Compare the kriging surface with known data patterns and geographic features for qualitative assessment.

Chapter 5: Advanced Kriging Techniques in QGIS
Exploring Advanced Kriging Options in QGIS
QGIS supports advanced kriging techniques that allow for more nuanced analysis:
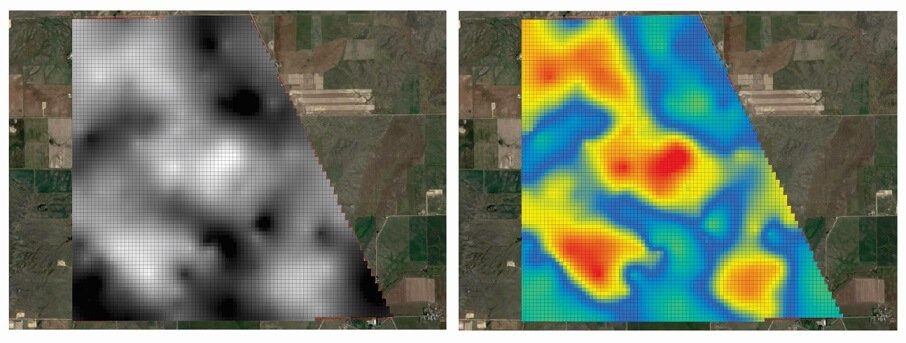
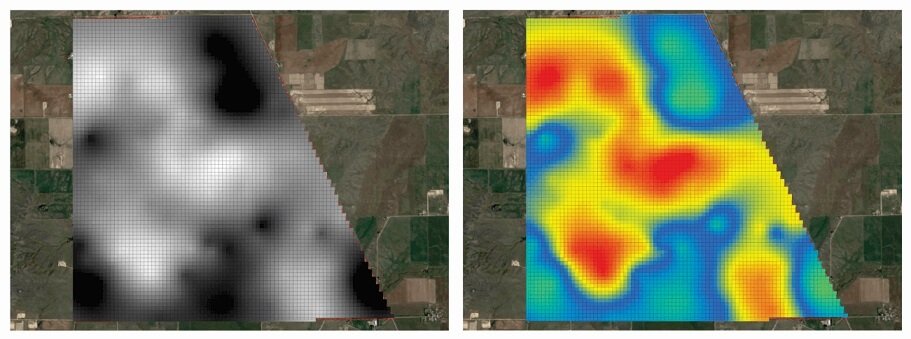
- Cokriging: Utilizes secondary datasets to improve predictions. Accessible through plugins or scripting, this method is ideal for complex analyses where multiple variables influence spatial patterns.
- Anisotropy Modeling: Adjusts for directional influences on spatial data, enhancing the accuracy of predictions in anisotropic fields.
Customizing Kriging Parameters for Specific Project Needs
Tailoring the kriging parameters to fit the unique requirements of your project can significantly improve outcomes:
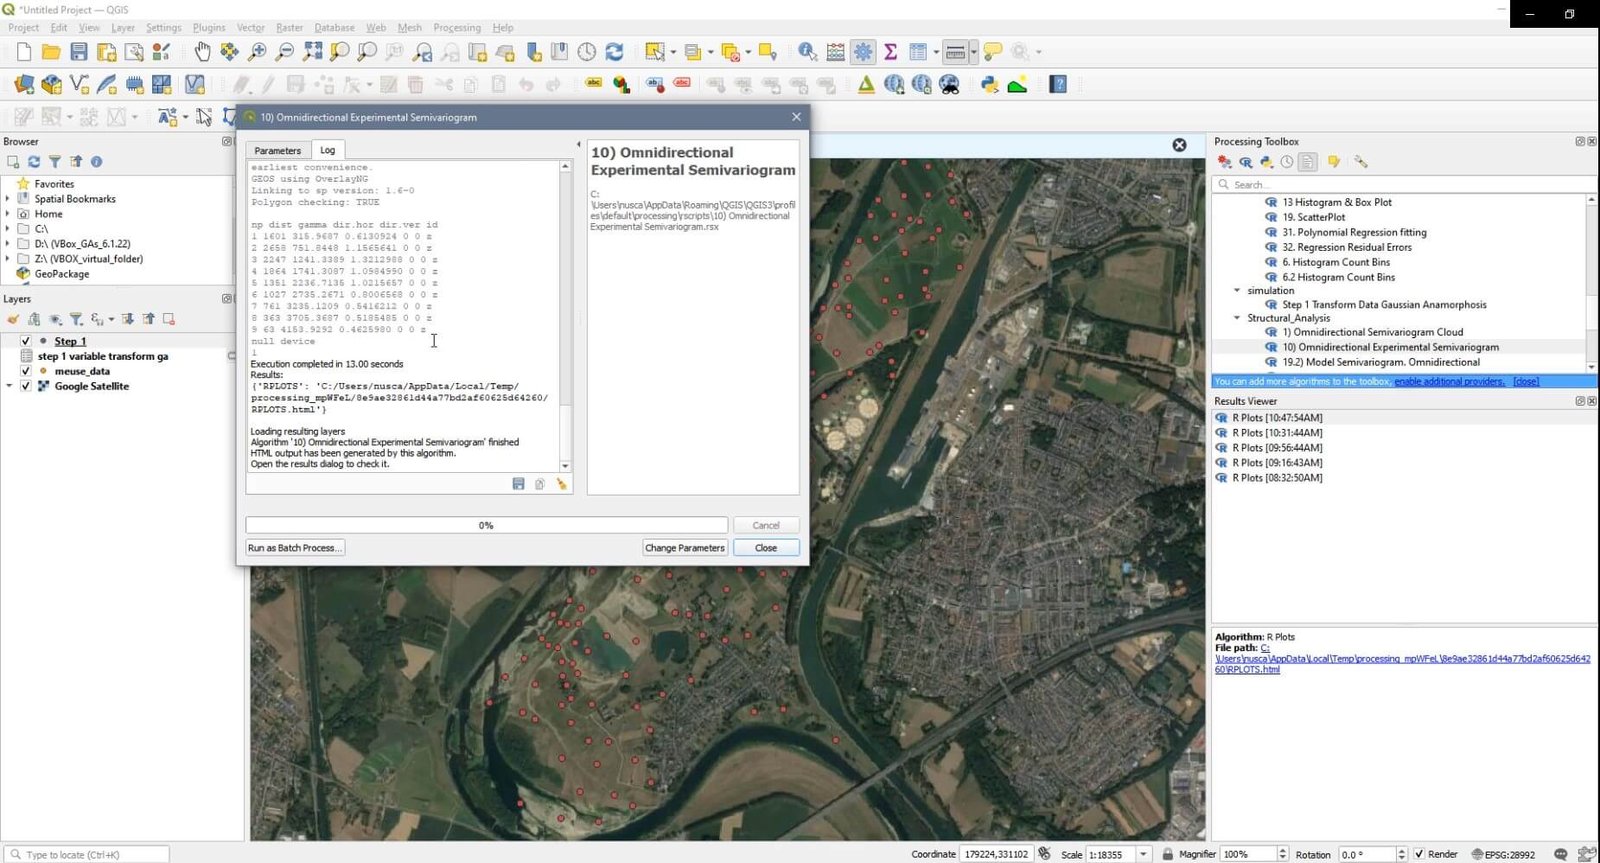
- Variogram Model Selection: Experiment with different variogram models to find the best fit for your data’s spatial characteristics.
- Search Radius: Adjusting the search radius can influence the local variance and the weight of distant points, offering control over the spatial influence in predictions.
Integrating Kriging with Other Spatial Analysis Techniques
Kriging can be part of a broader spatial analysis workflow:
- GIS Modeling: Combine kriging results with other GIS layers (e.g., elevation, land use) for more comprehensive environmental modeling.
- Spatial Statistics: Use kriging surfaces as input for spatial statistical analyses to identify significant patterns or anomalies.
By mastering both basic and advanced kriging techniques in QGIS, geospatial analysts can unlock powerful insights into their spatial data, enhancing decision-making processes and contributing to a deeper understanding of geographic phenomena.
Chapter 6: Practical Applications of Kriging in QGIS
Kriging, with its robust statistical underpinnings, has found applications across a broad spectrum of fields, offering insights that guide decision-making and research. This chapter explores real-world case studies and provides tips for conducting effective kriging analysis in various domains.
Case Studies: Real-World Applications of Kriging in Various Fields
- Environmental Science: In a study on groundwater contamination, kriging helped map the spread of pollutants, enabling targeted remediation efforts. By analyzing samples from various points, researchers could predict contamination levels in untested areas, prioritizing them for cleanup.
- Agriculture: Kriging has been instrumental in precision farming, where soil properties (such as moisture levels and nutrient content) are mapped. This allows for variable rate application of irrigation and fertilizers, optimizing resources and boosting yields.
- Public Health: Spatial analysis of disease prevalence using kriging has enabled public health officials to identify hotspots and allocate resources efficiently. For instance, mapping malaria incidence has helped in focusing preventive measures in high-risk zones.
- Urban Planning: Cities have utilized kriging to assess land use patterns and inform the development of infrastructure, such as roads and utilities, ensuring they meet the needs of growing populations effectively.
Tips for Effective Kriging Analysis in Environmental Science, Urban Planning, and Other Areas
- Understand Your Data: Begin with a thorough analysis of your dataset. Recognizing patterns, trends, and anomalies will guide the selection of the most appropriate kriging method.
- Choose the Right Kriging Model: Each variant of kriging serves specific analytical needs. Ordinary kriging is versatile for many applications, but universal kriging or cokriging might be better for datasets with trends or multiple influencing factors.
- Fine-Tune Parameters: Experiment with variogram models and parameters to find the best fit for your data. This step can significantly impact the accuracy of your results.
- Validate Your Results: Use a portion of your data as a test set to validate the kriging predictions. This practice helps in assessing the reliability of your analysis.
Chapter 7: Troubleshooting Common Issues and Improving Kriging Accuracy
Kriging, while powerful, can sometimes present challenges. This chapter addresses common issues and outlines best practices for enhancing the accuracy of kriging results.
Identifying and Resolving Common Issues in Kriging Analysis
- Inadequate Sample Size: Kriging requires a sufficient number of data points to accurately model spatial relationships. If you encounter issues with sparse data, consider collecting more samples or adjusting the search radius to include more points.
- Non-Stationarity: If your data shows trends (non-stationarity), ordinary kriging may not be the best choice. Universal kriging or detrending the data prior to analysis can help address this issue.
- Anisotropy Mismanagement: Anisotropy, or direction-dependent spatial variation, can skew results. Adjusting for anisotropy in the variogram model can improve accuracy.
Best Practices for Improving the Accuracy of Your Kriging Results
Chapter 8: Beyond Kriging – Advanced Spatial Analysis in QGIS
While kriging is a powerful tool for spatial analysis, QGIS offers a vast array of other interpolation and analysis techniques that can be better suited for specific projects. Understanding these alternatives and knowing when to apply them can significantly enhance your geospatial analyses.
Overview of Other Spatial Interpolation and Analysis Techniques in QGIS
- Inverse Distance Weighting (IDW): This method assumes that each input point has a local influence that diminishes with distance. It’s straightforward and useful for quick interpolations when data is evenly distributed.
- Splines: Splines are smoothing techniques that create a surface passing through or near the input points, ideal for creating smooth landscapes or elevation models.
- TIN Interpolation: Triangulated Irregular Networks (TIN) use a network of triangles based on the input points. This method is particularly effective for representing terrain surfaces.
- Spatial Autocorrelation Analysis: Beyond interpolation, spatial autocorrelation tools in QGIS can help identify patterns of clustering or dispersion across your data, providing insights into the spatial structure that might inform your choice of interpolation method.
When to Use Kriging vs. Other Methods for Your Geospatial Projects
The decision to use kriging over other methods depends on several factors, including the nature of your data, the specific requirements of your project, and the spatial patterns present in your dataset. Kriging is preferable when:
- Your data exhibits spatial autocorrelation that can be quantitatively modeled.
- You require estimates of prediction uncertainty along with the interpolated values.
- Your dataset has irregularly spaced points, making it unsuitable for grid-based methods like IDW.
In contrast, methods like IDW or splines might be more appropriate for datasets with a more uniform spatial distribution or when a simpler, faster interpolation is needed without the detailed statistical modeling that kriging provides.
Conclusion
Throughout this guide, we’ve explored the intricacies of kriging in QGIS, from the basics of spatial analysis and data preparation to advanced kriging techniques and troubleshooting common issues. We’ve also touched on the broader spectrum of spatial interpolation methods available in QGIS, highlighting the versatility and power of this open-source tool for geospatial professionals.
Recap of Key Points Covered in the Guide
- Kriging stands out for its ability to model spatial autocorrelation and provide detailed insights into prediction uncertainty.
- QGIS offers a comprehensive suite for performing both basic and advanced kriging analyses, along with a multitude of other spatial analysis tools.
- Understanding your data and the spatial processes at play is crucial for selecting the most appropriate interpolation method for your project.
The Future of Spatial Analysis with QGIS and Kriging
As QGIS continues to evolve, incorporating more sophisticated algorithms and enhancing user accessibility, the future of spatial analysis looks promising. Kriging, with its strong statistical foundation, will remain a key tool in the geospatial analyst’s toolkit, adaptable to the complexities of spatial data. The ongoing development of QGIS and its community-driven plugins ensures that geospatial professionals will have access to cutting-edge tools and techniques, enabling them to tackle increasingly complex spatial questions with confidence and precision.
Transform your spatial analysis with Kriging in QGIS. Our detailed courses will equip you with expert knowledge to excel in your geospatial projects. Don’t wait any longer to advance your career. Join our learning community today.
Frequently Asked Questions (FAQs)
1. Why is Kriging in QGIS considered a powerful tool for geospatial analysis?
Kriging in QGIS is seen as a powerful tool because it leverages the geostatistical technique of kriging, which provides more accurate spatial interpolations by accounting for the spatial correlation between data points. This method not only allows for precise predictions of unknown values but also estimates the uncertainty of these predictions, offering a depth of insight that simpler interpolation methods cannot.
2. How does Kriging in QGIS improve environmental monitoring and urban planning?
Kriging in QGIS enhances environmental monitoring and urban planning by offering a nuanced approach to predicting geographical phenomena, from pollutant distributions to resource allocation. Its ability to model spatial relationships and interpolate data accurately helps professionals make informed decisions, ensuring that interventions are precisely targeted and effective.
3. What makes Kriging different from other interpolation methods available in QGIS?
Unlike other interpolation methods in QGIS, Kriging takes into consideration the spatial correlation between points, ensuring predictions are not only based on proximity but also on the underlying spatial patterns of the dataset. This results in predictions that are both more accurate and accompanied by estimates of uncertainty, providing a clearer understanding of the data’s reliability.
4. Can you explain the process of setting up a Kriging analysis in QGIS?
Setting up a Kriging analysis in QGIS involves accessing the Processing Toolbox and selecting the appropriate kriging tool under the Interpolation methods. Users must then configure the kriging parameters, including the input data layer, the field to interpolate, and the variogram model that best fits the spatial structure of the data. This process is facilitated by QGIS’s user-friendly interface, which guides users through the setup to execute the analysis.
5. What are the practical applications of mastering Kriging in QGIS for a geospatial analyst?
Mastering Kriging in QGIS opens up a broad spectrum of applications for geospatial analysts, from environmental assessments and resource exploration to public health mapping and urban development planning. The technique’s ability to provide accurate, spatially-informed predictions enables analysts to contribute significantly to research and decision-making processes across various sectors, enhancing the value and impact of their work.
#QGIS, #RStats, #Kriging, #CoKriging, #GIS, #SpatialAnalysis, #DataVisualization, #Geostatistics, #DataScience, #OpenSource, #RemoteSensing
